

The Task-Exposure Ledger: Measuring the Quiet Transformation of Global GDP
For three years, we’ve measured AI in "wow" moments. In 2026, we finally have the hard numbers. The "AI Economic Dashboard" has emerged as the most critical tool in the modern boardroom, moving the conversation from speculative productivity to high-frequency reality.
I. The Shift: High-Frequency Indicators
The traditional GDP report is a rearview mirror—it tells you what happened three months ago. The 2026 Dashboards use Real-Time Task Auditing to show what is happening now.
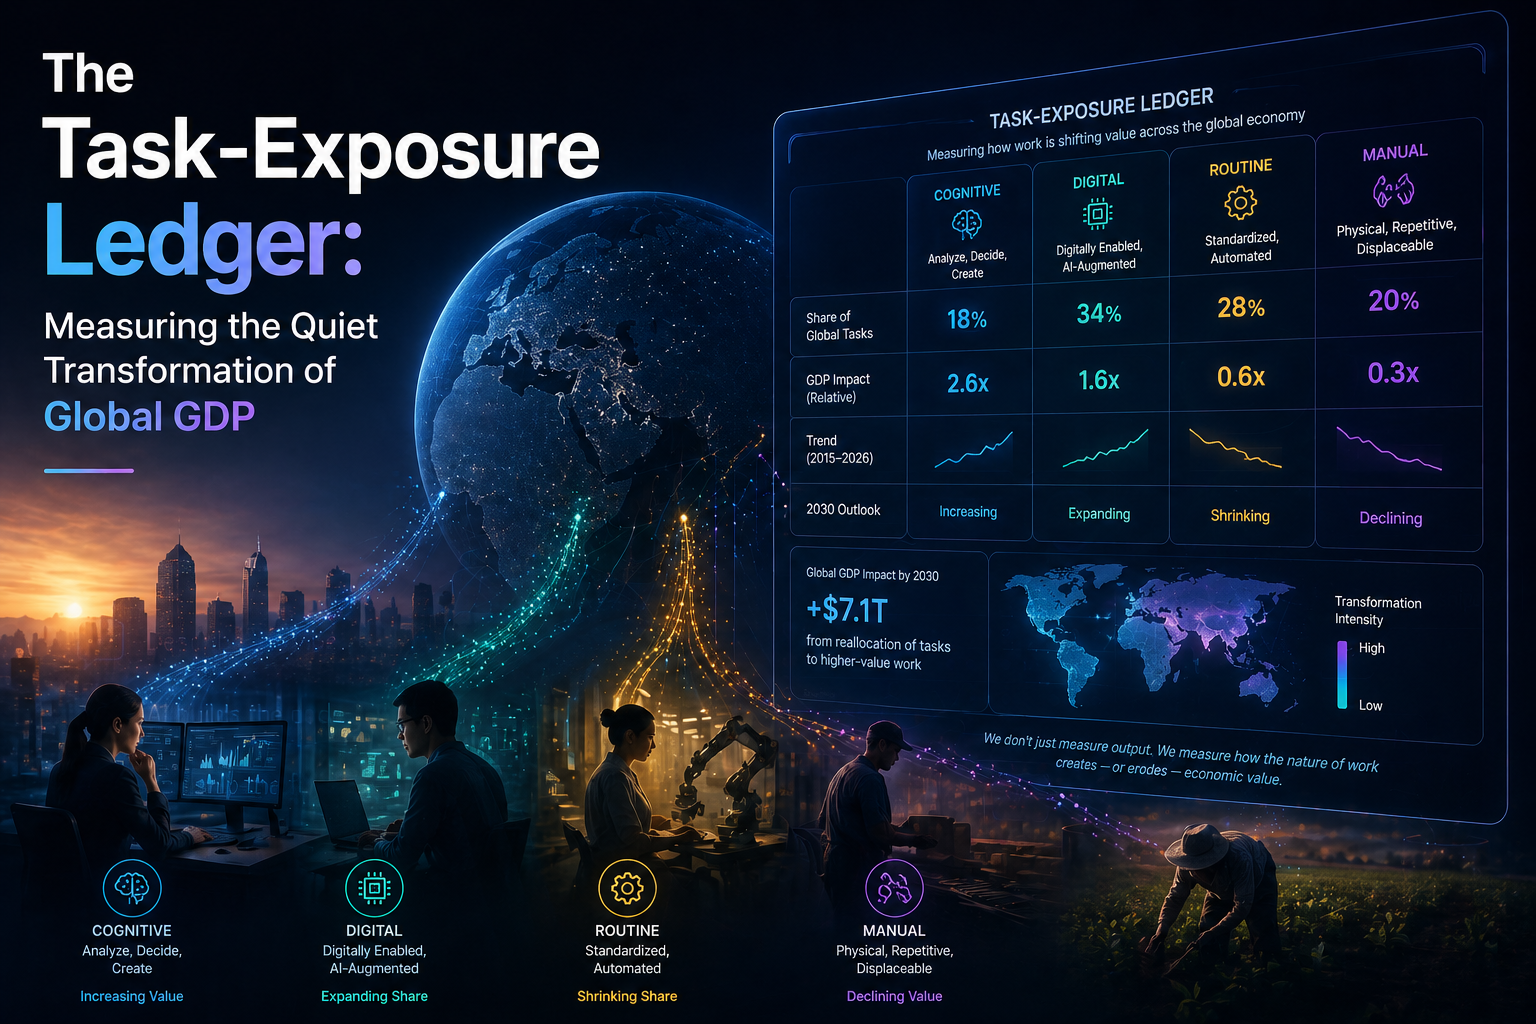
The Task-Level Pulse: We no longer look at "jobs lost." We look at Task Exposure. New dashboards from organizations like the Digital Economy Lab track exactly which tasks (not roles) are being absorbed by AI in real-time.
Infrastructure Delta: We are seeing a massive spike in "Nonresidential Fixed Investment." Data centers alone contributed 0.15 percentage points to GDP growth recently—a level of investment growth we haven't seen since the 1990s dot-com boom.
II. The "Agentic" Margin
The most exciting metric on today’s dashboard is the Agentic ROI. Companies are no longer just "using" AI; they are deploying autonomous agents into their workflows.
Observation: Early data suggests that "AI-First" small businesses are scaling 20% faster than their traditional peers. They aren't hiring more people; they are increasing the "Compute-to-Human" ratio.
Current Benchmarks for 2026:
Revenue per Employee: In AI-integrated firms, this metric has jumped by an average of 12% year-over-year.
Forecast Accuracy: Agentic dashboards have reduced financial "hallucinations" in budgeting by roughly 20%, allowing for continuous, rather than annual, forecasting.
III. The Social Equilibrium
A true economic dashboard doesn't just track profit; it tracks the Labor Shift.
The Wage Premium: There is now a documented 30% wage premium for roles requiring AI-literacy.
The Polarization Gap: While high-skill and low-skill service roles are seeing productivity boosts, the "Middle-Skill Squeeze" remains the dashboard's biggest red flag. Dashboards are now being used by governments to trigger Sovereign Retraining Credits when displacement in a specific sector hits a certain threshold.
IV. Summary of Impact (2026 Index)
Indicator Trend Status
Global GDP Contribution +2.7% Project Total 📈 Strengthening
Data Center Capex 30% of total growth 🔥 Peak Heat
Skill Imbalance Index High Cross-Country Variance ⚠️ Critical Concern
AI Inflation Deflator -0.3% (Goods prices) ✅ Cooling Effect
V. Closing Thought
The dashboard tells us that 2026 isn't an "average" year. Beneath the surface of steady 2.7% growth, the economy is being rewired. We aren't just building faster tools; we are building a more resilient, high-frequency foundation for global trade.
The question for leadership is no longer "Is AI working?" but "What does our specific dashboard say about our ROI this morning?"
Field Note: If your dashboard isn't tracking task-level productivity yet, you’re still flying blind. How are you measuring the "invisible" gains in your department?